Smart Football has moved!

Please check out the new site, smartfootball.com. All future updates will be made there.
Showing posts with label stats. Show all posts

Thursday, August 13, 2009

Smart Notes and Links 8/13/2009

1. Advanced NFL Stats weighs in on the evaluating running backs/running games discussion, which I addressed (with assistance from some wonderful comments) here and here. Do read the whole thing, but Brian has, as always, a very interesting take. Drawing on earlier discussion about risky and conservative strategies for underdogs and favorites (see my discussion of the topic here and Brian's here), he asserts:

I want to address an age-old water cooler question that Chris discussed in his post at Smart Football. Consider two RBs, both with identical YPC averages. One however, is a boom and bust guy, like Barry Sanders, and the other is a steady plodder like Jerome Bettis. Which kind of RB would you rather have on your team?

The answer is it depends. Essentially, we have a choice between a high-variance RB and a low-variance RB. When a team is an underdog team, it wants high-variance intermediate outcomes to maximize its chances of winning. And when a team is a favorite, it wants low-variance outcomes. Whether those outcomes occur through play selection, through 4th down doctrine, or through RB style, isn't important. If you're an otherwise below-average team, you'd want the boom and bust style RB. If you're an otherwise above-average team, you'd want the steady plodder. . . .

Further, even if the high-variance RB has a lower average YPC, we'd still want him carrying the ball when we're losing. This is due to the math involved in competing probability distributions.


That's just one aspect of it. He uses a handy chart for the distribution of runs for the various backs...
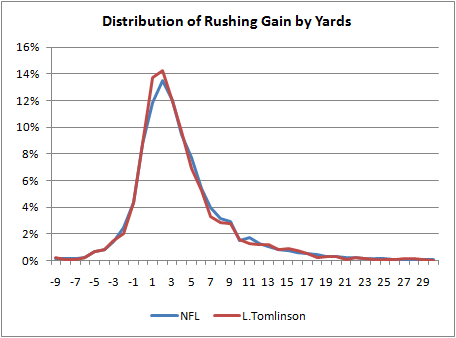


...and notes how curious it is that Tomlinson's distribution looks so much like that of the rest of the NFL. (This same thing ends up holding true for most backs.) What conclusions does Burke draw? With the usual caveats,

[w]hat amazes me is how similar they all are to each other and to the league average. . . . Usually, a RB needs 4 to 5 yards to just break even in terms of his team's probability of converting a first down. What we'd want to see on a RB's distribution is as much probability mass as possible to the right of 4 yards.

So if [Jerome] Bettis' distribution looks so much like Tomlinson's, how does Bettis have a 3.9 career YPC and Tomlinson have a 4.4 career YPC? As others have noted previously, the difference among RB YPC numbers primarily come from big runs. It's the open field breakaway ability that separates the guys with big YPC stats from the other RBs. Of Tomlinson's runs, 1.5% were for 30 yards or more. Bettis' 30+ yd gains comprised only 0.46% of his carries. The other RBs and the league average are as follows:

- NFL 0.91%
- [Jamal] Lewis 0.88%
- [Brian] Westbrook 0.93%
- [Adrian] Peterson 2.20%

Adrian Peterson's 2.2% figure is exceptional. It's interesting because it really suggests that what separates Peterson as a great runner is based on only 2% or so of his runs. Otherwise, he's practically average.


2. Courtesy of Brophy, I have added video of Mike Leach's "settle & noose" drill, which, it will be recalled, is both a great warm-up drill and works on teaching receivers to find holes in the zone and quarterbacks how to deliver the ball to them.


3. Tom Brady muses on life with Bill Belichick. As he tells Details:

"You'll practice on a Wednesday, and you'll come in Thursday morning and he'll have the film up there from practice," Brady says. "Sometimes, during practice, you throw a bad ball—that's the way it goes. But the video comes up and he says, 'Brady, you can't complete a g--damn hitch.' And I'll be sitting there thinking, I'm a [expletive] nine-year veteran, I've won three ---damn Super Bowls — he can kiss my... That's what you're thinking on the inside. But on the outside I'm thinking, You know what? I'm glad he's saying that. I'm glad that's what he's expecting, you know? Because that's what I should be expecting. That's what his style is."


(Ht Shutdown Corner).

4. Bruce Feldman chats with Norm Chow, who materializes into matter from various spectral rays to participate.

5. The NY Times's The Quad Blog chats with Dan Shanoff about, what else, his Tim Teblow blog.

6. Spencer Hall/Orson Swindle to SB Nation. When you get $7 million from Comcast, you better find ways to spend it, and I can't think of a better way than for SBNation (whose official name is "Sportsblogs, Inc.") to lure Every Day Should Be Saturday's Spencer Hall over, including away from the Sporting News. I like everyone else think this is a wise move for both sides, but one underrated aspect is that Mr. Hall/Swindle (Mr. Hall-Swindle? I kind of like that) will be able to focus on just one blog (and probably a book too), which should really let him flourish.

7. Holly over at Dr Saturday remembers Northwestern's magical 1995 season, which is still the only 10 win season in school history. This was a sort of epoch-changing season for NW -- though that is a very relative statement -- in that the Wildcats' history since has been considerably better. Indeed, two years later I saw them play in the Citrus Bowl against Tennessee (this was back in the "You can't spell Citrus without UT" days). Though, most of that game was spent marveling at the show Peyton Manning put on (408 yards, 4 touchdowns, no interceptions) as I sat there telling everyone around me what Peyton Manning's audibles would be (for some reason Northwestern thought it could play man coverage against Tennessee's receivers, so he kept checking to fades and slants). In any event, it is hard to overstate how strange but wonderful that 1995 season was for Northwestern. In football, sometimes the gods are with you.

Sunday, August 02, 2009

More on evaluating the run game

The discussion surrounding evaluating the run game was great. I will have more to add, but I wanted to highlight some of the best commentary. First, I did want to say that my focus was generally on two aspects, and I don't think I made that clear.

One, I really am more interested in running games, or a team's ability to run, than I am in one runningback versus another. I definitely play fantasy football myself, but it's not the reason I get interested in football stats. Instead I want to know how good an offense is, and then secondarily how good a particular play is; whether Barry Sanders or Emmitt Smith is better is usually not a discussion I get into. As a result I don't mind so much that it's hard to disassociate how good a runningback is from how good the line is, or the faking, etc. From an evaluation perspective, if you can analyze one play being better than another, then you can pretty easily ask if it is scheme or execution, and thus concepts or players.

Second, I do prefer to focus on easily observable stats. Some of this is maybe my laziness, but that's one big appeal of yards per carry: I know it has little application on third down. (One yard could be a success if it converts for a first down, and eight yards could be a failure if it was third and ten -- but then what if the draw was a good call rather than an interception or a sack? I digress.) That is just mainly aimed at seemingly interesting stats that would be a practical nightmare, based on every play and then a subjective interpretation of how many guys he bounced off of or his vision and cutback versus contact, etc -- you get the idea.

Anyway, Bill Connelly of Football Outsiders (and RockMNation) had actually discussed this fairly recently:

Regular Varsity Numbers readers have probably become familiar with some of the basic VN concepts, namely PPP (Points Per Play) and the "+". PPP is a measure of explosiveness--the amount of Equivalent Points (EqPts) averaged per play. The "+" number compares an offense's output to the output expected against a given defense, and vice versa. With the "+" number, 100 is average, anything above 100 is good, and anything below 100 is bad.

Points Over Expected

Is there any way to use these concepts to come up with a good rushing measure? Of course! Meet POE (Points Over Expected), the collegiate stepchild of DYAR. Whereas a rusher's PPP+ would compare his EqPts output to what would be expected, and is therefore great for measuring an offense's overall effectiveness, POE is cumulative. It is a comparison of a rusher's total EqPts to the Expected EqPt total, subtracting the latter from the former.

POE = EqPts - Expected EqPts. . . .

Most Varsity Numbers measures, in one way or another, bounce output versus expected output. POE, a brother to PPP and cousin to S&P and S&P+, does just that. POE, which intends to both evaluate both per-play and cumulative success, could also be used to evaluate receivers and tight ends, but that will be hard without good "pass intended for _____" data (some college play-by-plays record detailed information in this regard, others do not). Right now, it is an RB-only figure, but it is a pretty good one.


Not sure I entirely buy this as the best method (requires getting into the nitty gritty of FO's methods), but overall this is a good starting spot. It tends to reward the explosive players.

Moving to the comments, a few highlights, though all were excellent. Brad said:

I don't think getting long runs is the only way a back can improve his average. He can also do so by getting less short gains.

Think of a back that gets 3 yds minimum on slightly over half of his carries and gets 6 yds on the rest. Then compare him to a back that gets loses a yard on a third of his carries gets 3 yards on a third of his carries and gains 10 yards on a third of his carries.

Both backs have a median rush of 3 yds, but the first back averages around 5 yds per carry while the second one averages only 4. However the second back clearly has more "Big play potential" because he gains 10 yards on 1/3 of his runs.

My point is that a back can improve his average vs median both by getting more long gains OR by having less short runs. Which of these two things that great backs do is a question for the data.


I should have conceptualized this better in the first place, because this helps explain why Reggie Bush has been such a mediocre rusher in the NFL. It's not his explosiveness (though he hasn't broken many very long runs), but his routine bad plays. It also is why Emmitt Smith and Barry Sanders are so hard to compare: Barry's stat line was full of negative plays and small gains, but checkered with the spectacular long runs. Emmitt Smith, the opposite. (And I don't think with Barry it was all just jump and bad blocking; it was also just his running style. Do you think he would have fit in well with the Denver Broncos "one-cut-and-go" philosophy? People say "oh, if he had played for them he would have had 3,000 yards but I'm not so sure.)

Tom points me to another good bit from Football Outsiders, this time by Mike Tanier, quoted at length:


The 4.0-4.1 yard average is an arithmetic mean: add up all the yards, divide by the attempts. The arithmetic mean is easily skewed by extremes in data. A 75-yard run can increase a starting running back's rushing average by several tenths of a point by the end of a season. This skewing always increases rushing averages: there are several 50+ yard rushes every year, but no 50+ yard losses on running plays.

We all know that a few big plays can make a mediocre running back's rushing average look great. But how much effect do long gains have on the league rushing average? The best way to see this is to break down every running play by distance. . . . The table reveals a surprising fact: the mean carry may yield four yards, but the median carry yields only three yards, and the data distribution is centered at two yards. . . .

Over 20 percent of running plays gain zero or one yards. Factor in losses, and over one-fourth of all runs result in negative or negligible yardage. The rushing average for the plays in the -4-to-10 yard range in 2005 was 2.95 yards per attempt. Long runs make up only about nine percent of all rushing plays, but they increase the league rushing average by over 40 percent. . . .

As a way of negating the importance of team strength as well as studying the contrasts between rushing styles, let's examine a pair of teammates from 2005.

Last season, Tatum Bell gained 920 yards and averaged 5.3 yards per carry. Mike Anderson gained 1,014 yards but averaged just 4.2 yards per carry. Despite the wide disparity in yards per carry, DVOA and DPAR ranked Anderson as the better back. Anderson was 37.0 points above replacement level, Bell 16.4. Anderson was 20.3 percent better than the average back, Bell just 7.6 percent.

Bell's rushing average was inflated by several long runs: he had a 68, 67, and 55 yard run in 2005, plus several 35-yard runs. Anderson's longest carry of the season was 44 yards, and that was his only run longer than 25 yards. We all know that Bell is a "home run threat" while Anderson is more consistent. But is it really fair to downgrade Bell because of his long runs? We're inclined to downgrade Bell somewhat because so much of his value is contained in a few plays. But is that really fair? After all, gaining four yards at a time is great and all, but big plays are pretty important, too. . . .

Anderson's yardage distribution is centered in the 2-3 yard range, while Bell's is centered in the 1-2 yard range, giving Anderson a full yard-per-play advantage on carry after carry. Bell's advantage, of course, is on runs of more than 10 yards. All but 6.5 percent of Anderson's runs gain from -4 to 10 yards, while 10.5 percent of Bell's runs are outside the chart (he only lost five yards on one play last season). Give them both 200 carries, and Bell will have eight more long runs than Anderson, and those runs will be longer than what Anderson can usually muster. But Anderson will gain an extra yard that Bell couldn't on dozens of other
runs. . . .

Anderson's in-the-box mean was 3.36 yards per attempt, noting again that his "box" is larger. Bell's was just 2.67. What's interesting is that we tend to think of backs like Anderson as "ordinary" while backs with Bell's big-play potential are held in higher esteem. But Bell's rushing distribution is more in line with the league norms than Anderson's. He's very good, but his contributions are typical of what backs around the league provide. Anderson, at least in 2005, was the unique player, providing hard-to-get, down-in, down-out production.

The difference between Bell and Anderson suggests that "cloud of dust" backs are more valuable than "boom or bust" backs, but we must be careful when using cheesy labels. Our perception of a back's production profile are often way off. How would you classify Marshall Faulk in his prime? Probably as a boom-or-bust back, albeit one with lots of boom and only a little bust.

But Faulk's running distributions show that in his prime he was much more than a big-play machine. . . .

Faulk's in-the-box mean was 3.37, a very good figure. What's more, his "box" only included 86 percent of his runs. Faulk had seven 12-yard runs, six 16-yard runs, and three 18-yard runs in 2000, giving him a very high percentage of 11-20 yard runs. But what's most remarkable about his production was his ability to avoid no-gainers and his above-average totals in the 3-5 yard range. Fast, shifty Faulk was just as good at using his skills to gain a yard or two as he was at burning defenses for long gains.

By contrast, [Jonathan] Stewart's ability to avoid losses and pick up two or three yards couldn't offset his complete lack of big-play potential. At first glance, Stewart's distribution looks similar to Anderson's. But his in-the-box mean of 2.8 is over a half-yard lower. The differences are subtle -- Anderson is a little more likely to gain five or six yards and a little less likely to lose yardage -- but they add up over a few hundred carries. And Stewart, like Anderson, concentrated 95 percent of his carries in the -4-to-10 yard range, so he had few 10-20 yard bursts to increase his productivity. Stewart, like Anderson, was providing a unique skill, which is why he was able to stay in the league for several years. Unlike Anderson, he wasn't a great exemplar of that skill, and the Football Outsiders metrics took him to task for it. . . .

Teams don't generate rushing yards in three-, four-, or five-yard bursts. They gain it through punctuated equilibrium, waiting through dozens of minimal gains for a few big plays per game.

And those big plays aren't that big. We've focused on gains of ten or less in this article, ignoring the 10.5 percent or so of plays that yield more yardage. The vast majority of those runs gain 11-20 yards: 6.9 percent overall. Almost 25 percent of the rushing yardage gained in the NFL is generated on runs of 11-20 yards. There were 960 such runs last year: 30 per team, or just over two per team per game. Amazingly nearly 10 percent of all rushing yardage is generated on runs of 30 or more yards, plays which occur about four times per year for a typical team.

These distribution breakdowns are so interesting that they might seduce us into making some wacky conclusions. Keep in mind that all of these averages and distribution patterns are situation dependent. . . .

Without further study, we shouldn't leap to grand conclusions. But we know this much: if we expect to gain four or five yards on every running play, we're going to be disappointed most of the time. No wonder passing totals have been creeping up for decades. If all a handoff gets you is two yards and a cloud of dust, you might as well throw the ball.


Lots going on here, but it mostly just reinforces what we know: Backs and teams have different styles, and it is not always easy to compare them; you want a guy who (a) does not lose yardage, (b) consistently gets positive yardage, and (c) is a big-play threat. They don't always come that way, so it is interesting that Tanier and FO conclude that the consistent back is simply better than the big-play threat. I'd like to see more to support that -- i.e. that the "dozens of first downs" or extra yards Anderson might have pulled down for the team were worth more than Tatum Bell's big plays. I'm not saying I disagree, but that it is interesting. That kind of conclusion could have troubling implications for a guy like, say, Barry Sanders, or moreso Reggie Bush.

Chase of the PFR Blog points out marginal yards, and adds:

I looked at rushing yards over 3.0 yards per carry. However, as the author has implied, I've begun shifting my focus away from yards per carry.

Rushing first downs is a key part of evaluating a running game. Without play by play information, I'd want to focus on rushing first downs, rushing yards, rushing TDs and carries.


I think this is good; rushing first downs should be part of the evaluation. According to CFBStats, last season's top first-down teams in college football are an expected bunch:

1. Air Force
2. Tulsa
3. Navy
4. Nevada (tie)
4. Oklahoma State (tie)
6. Oregon
7. TCU
8. Florida
9. Oklahoma
10. Georgia Tech

As a side note, I do think yards per carry is most useful on first down, and CFB Stats (as well as the pro-football reference site), has a ready breakdown of rushing stats by down, for all teams. For example, the yards per carry of the top 5 teams in the country last year, limited solely to first down, were:

1. Nevada 6.95
2. Louisiana-Lafayette 6.77
3. Florida 6.76
4. Navy 1843 6.12
5. Oregon 1676 5.96

Each team had over 1,600 yards on first down alone (everyone bud Oregon had over 1,800, and Nevada over 2,000). And those averages -- yes I just pasted that thing from FO saying you can't solely look at averages -- indicates that these teams had a lot of favorable down and distances to convert (Louisiana-Lafayette, the one seemingly strange entry, was in the top 15 of total offense last year despite not being a great throwing team).

In the end ... I have to think about this question some more. I think we're moving in the right direction, as, again, part of my motivation is to find handy and easy to use stats (thus one reason I dislike the idea of some kind of "running back efficiency rating" like they use with quarterbacks). I agree that the debate is going to be between styles of running game (or running back), as well as situation. I would imagine that teams like Oregon or Georgia Tech are going to have much different looking rushing distributions than, say, Wisconsin. But we're on our way down the path to the end.

End note: I'll be on vacation this week. I have a couple of posts set to go up, but otherwise I'll be out of pocket until next weekend/week. Cheers.

Tuesday, July 28, 2009

Responses to responses about David and Goliath Strategies

Tomahawk Nation responds to my earlier post on David & Goliath Strategies. See parts one and two of TN's responses. (See also my post on conservative and risky strategies and kurtosis.) Both pieces are well worth the read (I am a supporter of anything that combines football and six sigma). But a couple basic thoughts:

First, I completely agree with the idea of reducing variation, particularly negative variation. That really is the genius of Bill Walsh's passing game: what he brought to the game was a reduction of risk related to passing. Passing had been the quintessential "underdog" or David strategy; he reduced risk so much it arguably stopped being a David strategy and became a dominant one.

But I'm not sure if I agree with this:

Think of UF. To me, the Urban Meyer offense at Utah is a prime example of a David strategy. As he moved to Florida, he helped a Goliath school with Goliath resources begin to think like a David. People said that his offense would never work in the SEC, the QB would get killed, defenses were too fast, etc. But Meyer knew that his approach took advantage of a weakness in defenses, and if executed properly wouldn't be nearly as risky as people thought. Think back to the Ole Miss game from 2 years ago (the game that might have won Tim Tebow the Heisman). When the basic structures of the Meyer offense failed to work against the Ole Miss defense (Goliath being unable to hit David with his sling), and Ole Miss still allowed UF to stay in the game (Goliath managing to fight to a draw with David in a slingshot battle), UF was able to run Tim Tebow left/Tim Tebow right to win the game (Goliath is able to fall back on his superior size and strength combination to win the battle). . . .

...Gladwell highlighted the press in basketball as an example of a David strategy. Why is this a David strategy? Because Goliath doesn't focus on beating the press as much as David focuses on executing it. Because it takes Goliath out of his comfort zone. And honestly, because frequently the top point guards in the country have a certain level of confidence/cockiness in themselves that makes them want to beat the press by themselves and not rely on their teammates. The goal of the press is also to force the ball into someone's hands who is not used to handling the ball-- an inefficiency in Goliath's approach. This is how a team can use the David strategy to capitalize on an advantage. It's a risk, but if executed correctly it's not just a risk for the sake of being risky.


But is that really a David, or underdog strategy? Or is it a dominant strategy? I.e. better no matter who you are? One of the reasons I wrote my post was that I thought Gladwell confuses this point too, and I also concede at the end of the post that one conceptual difficulty is that some strategies are better for favorites (Goliaths conservative, low variance strategies), some solely for underdogs (risky David strategies), but some strategies are simply better no matter who you are (dominant), or inferior (punting on first down).

The things Tomahawk Nation is focusing on are, to me at least, dominant: better matchups, an unusual strategy the favorite is not ready for, etc. Admittedly, Gladwell confuses these two concepts -- or at least doesn't tease them out -- but I do think it's important.

To better illustrate what I mean, Advanced NFL stats showed that David strategies are often beneficial for underdogs even when they are basically inferior overall. In other words, even if a strategy would result in fewer expected points, it still would benefit the underdog because it still could get lucky. As ANFL explains:

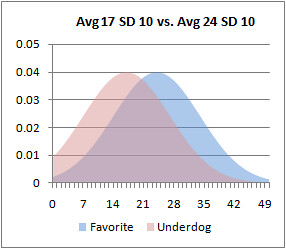
Here’s why underdogs should play aggressive and risky gameplans. Take an example where one team is a 7-point favorite over its underdog opponent. Say the favorite would average 24 points and the underdog would average 17 points. With a SD of 10 points for each team, the underdog upsets the favorite 31.5% of the time. The favorite’s scoring distribution is blue and the underdog’s is red.


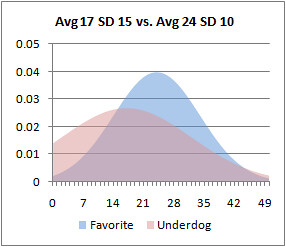
But if the underdog plays a more aggressive high-variance strategy, increasing its SD to 15 points, it would upset the favorite 35.3% of the time.


Note that I haven’t increased the underdog’s average score in any way, just its variance. The increase in its chance of winning results due to more of its probability mass moving to the right of the favorite’s mean score of 24. In fact, the higher the variance, the wider the probability mass will be spread. Consequently, more mass will be to right side of the favorite’s average score. But more mass will also be to the left, meaning there is a higher risk of an embarrassing blowout.

Even if employing a high-variance strategy is non-optimum, it can still help an underdog. In other words, even if an aggressive gameplan results in an overall reduction in average points scored, it often still results in a better chance of winning.


Yet would there be any reason for a Goliath to use this strategy? No, not at all. All it would be doing is inviting variance that would result in a few more upsets, and in fact might make the team worse (though could give the illusion of success because, again, of its high variance, resulting in a few high-scoring output games).

This is the biggest problem with the example TN uses:

Goliath University believes in the old Big Ten philosophy, 3 yards and a cloud of dust. Let's say they've even perfected their approach to the point that they can get exactly 3.3333 yards every time without ever turning the ball over. There is no risk involved and they know exactly what they are going to get with every play. Per play, they expect to get around .23 points. In true Goliath fashion, however, they run a quick, no-huddle offense in order to maximize the number of trials on the field. Over the course of the game this translates (assuming about 100 plays per game) to about 23 points and let's say a little over 30 minutes T.O.P. They'd win most of their games, but they'd lose any game where their defense gave up 24 or more due to random variation in the amount of time their opponent held the ball.

Goliath State University instead takes a more wide open approach, similar to Tulsa's offense. They throw the ball a lot more often, and go downfield more frequently as well. There is a lot more uncertainty associated with this approach, as there are many possible outcomes to their plays. However, through the strength of their preparation, they have a 50% chance of completing any given pass. Each of their 5 options (4 receivers and a QB run) has a 10% chance of success.

* If the QB runs, there is a 70% chance he will gain 4 yards, a 25% chance he will gain 14, and a 5% chance he scores
* Receiver A is running our deep fly, and there is a 50% chance he gets a 40 yard completion and a 50% chance he scores
* Receiver B is running the post, and there is a 80% chance he will get a 14 yard completion and a 20% chance he scores
* Receiver C is running the out, there is a 95% chance he gets 7 yards and a 5% chance he scores
* Receiver D is running the drag, there is a 95% chance he gets 4 yards and a 5% chance he scores

The expected point value of this play is:

.5*.1*((.7*.23+.25*1+.05*7)+(.5*3+.5*7)+(.8*1+.2*7)+(.95*.5+.05*7)+(.95*.23+.05*7)) = .468 expected points per play


Again, this is simply a better strategy, which is different than being a David strategy. Risk does not automatically equal David, and very conservative does not equal Goliath. Sometimes there is still better or worse.

To be fair, there is some indication in the TN pieces that this comes through. It repeatedly discusses the need to reduce the riskiness of these strategies "through film study, personnel decisions, and practice." Again though, I would argue that (a) these extra resources are themselves often a Goliath strategy (this becomes evident at high school for sure, but also in college with big differentials in resources, film equipment, practice materials, etc), and (b) practice and preparation is the quintessential dominant strategy -- it neither favors the underdog nor favorite, it's just a good idea!

The upshot is that these are two very good pieces, and well worth the read. I just want to emphasize my earlier point that I am using David and Goliath strategies in a very specific way, and one that differs slightly from Gladwell (it may not even be correct, it's just how I am using it). A true "David strategy" is one that, by definition, would not be good for a Goliath, because it is riskier. I used the example of extra fake punts, onside kicks, going for it on fourth, trick plays, etc. Relatedly, some Goliath strategies are low variance but that doesn't mean they have to be literally three-yards and a cloud of dust.

But the important point that TN clearly does get is that, Goliaths may nevertheless act suboptimally, and it is the underdogs and Davids that might discover the better, dominant strategies. The dominant ones will be adopted by those Goliaths (think of the spread of the spread, with its ability to push boundaries while keeping risk low), and others, though derided mightily as "gimmicks," simply might be appropriate for an underdog. It's not always easy to tell the difference, but this is an idea definitely worth continued exploration.

Friday, July 24, 2009

What makes a good running back? How do you evaluate how good a team's run game is?

The pro-football reference blog recently mentioned something I found fascinating:

What about rushing? . . . .In modern times, most RBs have a median carry length of three yards. I suspect that’s been the case for the majority of RBs for a long time. LenDale White and his 3.9 YPC last season? Median rush of 3 yards. Adrian Peterson and his 4.8 YPC? Median rush of 3 yards.


I think this has powerful implications. If most runningbacks tend to have the same median rush, then those who are more effective -- and hence have higher averages -- would be almost exclusively based on their big-play ability. (That big-play ability could still come in different forms, i.e. the guy who consistently can turn five yarders into 15 yarders, or the guy who can break every 10th or 15th rush into a 50 yarder.)

But this would imply that the powerback, or at least the powerback who is not considered so explosive, is overrated. (Earl Campbell could run you over and break off big gains.) The point is just that the premium would not be on the player's results on the average plays, but instead on the longer ones. Some of this too can be the surrounding cast. Indeed, as Homer Smith has said, a runningback who gets 130 yards on 20 carries plays in a better offense (either because of him or for whatever other reason) than a guy who gets 145 on 35 carries.

But this does all assume that average yards per carry is the most important stat. I'm not sure all would agree that it is. (In fact, I think the PFR Blog folks might not agree, as they ranked runningbacks and included their total carries and pure total yards as a key factor.) I'm not convinced that more carries means a better back or better running game, as that depends on the game situation (does the team get a lot of leads?) and also that the play-calling is optimal. I can also buy that on 3rd and 3, or third and goal, the point is to convert, not to help the average.

Yet then how else can we evaluate running backs, or even a running game more generally? A perusal of the best offenses and running games in college tends to show that the best all have high yards per carry; not too many BCS teams have averaged fewer than 4.5 yards per carry, and several have averaged well over five yards per rush attempt (including sacks, which count against the run game total in college).

So I'm opening the floor to better ideas. IF yards per attempt is the best metric (for either an individual back or a team's run game), and IF the median truly is right around 3 yards for great and average backs alike, then the difference between good and mediocre runningbacks and rushing teams would seem to be wholly in the explosiveness of the upper 50% of plays: a good team or player can rip off big gains, and turn big gains into touchdowns, while the average plays for both is about the same. (And maybe negative plays are overrated.)

But I'm interesting in everyone's thoughts on this question. How do you evaluate the running game?

Monday, July 13, 2009

Jay Cutler vs. Kyle Orton vs. Rex Grossman, by the numbers

KC Joyner, of Scientific Football fame and currently guest-blogging at the NY Times Fifth Down Blog, continues to ruffle feathers. He claims that former Broncos quarterback Cutler will be equally mediocre or worse than the two previous Bears QBs, Kyle Orton and Rex Grossman. Joyner:

Alex from Chicago asked how well I thought Jay Cutler would do with the Bears this year. I told him: “I’ve said it many times and I’ll say it again — Cutler will make Bears fans remember Rex Grossman. He’ll make just as many crazy passes but won’t suffer the Grossman fate because Chicago’s fan base is so in love with him that they will forgive the nutty throws he makes in ways that they never forgave Grossman.” ....

Now I understand that fan scrutiny comes with the territory, so I don’t mind that, but what I don’t understand is why those fans are treating Cutler differently than they did either Grossman or Kyle Orton.

Grossman was on fire during the first part of Chicago’s Super Bowl season, and yet as soon as he had the bad game against Miami, it seemed the entire city turned on him. It didn’t go that much differently for Orton. He had a tremendous start to the 2008 season, but when he struggled down the stretch, the populace seemed to say goodbye and good riddance without much of a second thought.

I also don’t understand why there seems to be such excitement about Cutler. Yes, he threw for over 4,500 yards last year, but that was in large part because he put the ball up a whopping 616 times. His 9.8 vertical YPA was lower than that of 19 other QBs last season, and his 4.6% bad decision rate (a bad decision being a mistake by the QB that leads to a turnover or a near turnover) was easily the worst of any QB. He was also the offensive leader for a team that blew a three-game division lead with three games to go. . . .

The only reason I can come up with as to why Bears fans are reacting like this is that the quarterback position has been such a headache for them over the years that they will do just about anything to make it go away. If that means ignoring Cutler’s shortcomings so that at least one off-season goes by without having to wonder if their quarterback’s play will measure up, they’ll do it just for the temporary peace of mind. I do admire that kind of team passion and loyalty, but I’d admire it a bit more if it were done by hoping that Cutler could improve his game rather than by backing his mixed bag of performance history.


Note that he conflates two comparisons, and it's unclear what he's saying precisely. One is that Cutler is the better quarterback, but it is Chicago and thus his success will be pretty much on par with what the other Chicago QBs did. The other is that Cutler is simply no better of a quarterback than Grossman or Orton, and it only appears that way because he threw the ball so much.

My favorite passing stat is yards per attempt, because it sweeps in both completion percentage and the yards gained on the completion; I think it reflects the trade-off between pushing the ball downfield and taking the easier completion for less yardage. I like to adjust it, however, to account for interceptions: I subtract 45 yards for every interception thrown, as that is the basic estimate of how much field position/value you lose. No stat is perfect, but I like this one a lot.

  • In 2008, Jay Cutler threw for 4,526 yards on 616 attempts. He also threw 18 interceptions. Together, that gives him an Adjusted Yards Per Attempt of 6.03.
  • In 2008, Kyle Orton threw for 2,972 yards on 465 attempts, along with 12 interceptions. Together, his Adj. YPA was 5.23.
  • In 2006, the year the Bears went to the Super Bowl, Rex Grossman threw for 3,193 yards on 480 pass attempts. He also threw 20 interceptions. Together, his Adj. YPA was 4.78.

Again, this is just one stat, but I think it's a pretty good indicator, and Cutler far and away scores the best. And, ironically, he does so despite so many more pass attempts: YPA tends to trend back down once a passer goes beyond being mostly a play-action type guy as a play off the ground game, like Ben Roethlisberger has been for much of his career.

Relatedly, let's take Advanced NFL Stats's "Air yards" stat, which calculates yards per attempt without reference to yards after the catch -- yards gained by receivers after they catch the ball. (This stat tends to both measure a QB's ability to complete downfield passes, as well as their propensity to check the ball down to a runningback. Young quarterbacks tend to score most poorly on the list because they struggle downfield and dump the ball off quite a bit.)

Cutler comes in at 7th in the league at 4.3 yards per attempt (again, just "Air yards"), while Orton is 29th with 3.3. In 2006, Grossman's was 3.9, and, in 2007 on much less work, it was 3.5. For comparison, Brady and Manning have spent most of the last few years hovering between 4.9-5.2 (though Peyton dipped to 4.3 this past season).

Having looked at these stats, I think the question is why does KC Joyner think Cutler will be no better than Grossman or Orton?

Monday, June 08, 2009

"Confabulatory" rankings of college football players

So I stumbled on "The College Football Performance Awards" site. Its mission statement is "to provide the most scientifically rigorous conferments in college football. Recipients are selected exclusively based upon objective scientific rankings." The basic driver seems to be that the ballot system, whereby some names are picked, some folks vote, and somebody wins, is an inherently flawed way to select football players; indeed, it is, they argue, more like a "popularity contest."

I suppose there's some merit to that proposition. The idea is that there must be some better way to evaluate a player, particularly if a player wins an award because of his strong supporting cast as opposed to what he individually brings to the field. Brad Smith, former Davidson and USC kicker who runs the site, also seems to have the laudable goal of including more mid-major program players into the final award mix. For example, in his rankings Rice quarterback Chase Clement finished higher in the overall rankings than Tim Tebow (Colt McCoy finished #1). So these are generally laudable goals but I still don't quite know what to make of all this.

First, the value of any so-called "objective metric" is in how good the algorithm is. On that score, despite journalists telling us that Mr. Smith's "methodology is all there on the website," I come to find out that it is not.

Smith tells us simply:

The goal of this research is to advance a sophisticated representation of college football; a just, refined, and elegant measurement of performance; a precise, objective, and scientifically reliable selection of deserving recipients; an inherently dispassionate, methodologically sound, and experimentally valid celebration of individual achievement.


But that's really it for explanation, just cool assurances that it is an elegant, sound, and valid "celebration." My favorite of course is his discussion of why rushing yards is inadequate, which I must paste in full:

Q: Is football performance analysis a form of scientific enquiry?

A: The question, "Who are the top performers in college football?" is an inherently empirical question. In other words, any attempt to answer this question trespasses overtly on the domain of science.

PERFORMANCE 101: ANALYZING RUSHING DATA

The college football player with the most rushing yards per game is sometimes referred to as the "rushing leader". This usage is misleading and, in some sense, even confabulatory. In reality, the rushing yards per game statistic is not very helpful in evaluating rushing performance and is a poor predictor of team success. For an example of this, consider running back A with 900 yards on 300 carries, B with 870 yards on 145 carries, C with 840 yards on 120 carries, and D with 800 yards on 80 carries. Further, assume that A, B, C, and D have all played the same number of games, and all other rushing variables are held constant. According to the rushing yards per game statistic, A is the rushing leader, B is second, C is third, and D is fourth. Yet, almost certainly, these rankings are inverted. After all, in this case, the discrepancies in rushing yards per game are fairly small, while there are significant differences in rushing yards per carry. To declare A the rushing leader merely based upon A's standing in rushing yards per game without careful review of other factors and considerations is at best -- a cursory and superficial analysis, and at worst -- a specious and obfuscatory one.


I know what is "obfuscatory," and it is not just the ballot system. (I also enjoy spelling "enquiry" with an "E"; he was a philosophy major so I guess he has to spell it the way David Hume did.)

But all this begs this question. He tell us that subjective views of a runningback, or even a "scientific" review based on total yards doesn't tell us much. This is of course all rather pedestrian, but he he doesn't tell us what the next step is. Is it average yards per carry? Some mixture? He doesn't say. There is no explanation of his methodology.

He does have an "academic review" section, but these fine folk don't really discuss his actual methods, and instead seem to comment only on the general idea that objective, statistics-based criteria for ballots is inherently better than the ad hoc poll/ballot system currently in use. All quite possibly true, but merely stating that is not enough. (He also has a section titled "models," which I clicked on thinking it would tell me about his algorithms or the models he used to rank players. I was wrong, but it is likely worth clicking on anyway.)

The reason this is significant is because, contrary to what he seems to think, he's not the first guy to try to evaluate players based on the statistics. Football Outsiders has been trying to do this for over a decade, and the Pro-Football Reference site is another notable site which has gone into great detail and has laid it out for the world to understand. These enquiries, along with many others, have been going on for some time, and are free from the ballot box problems he identifies.

But the other reason it is significant, in light of his apparent thought that he is the first to finally Rank All That Is Good in Football, is that we've learned a lot about how difficult it is to model and evaluate players because of the hard work and transparency of these other sites and books. It isn't easy. He claims to be able to extract the fact that Colt McCoy is better individually than Sam Bradford, or that Dez Bryant was better than Michael Crabtree; any differences in results were just based on teammates. Maybe so, but how can you be sure? And how do you apply that kind of analysis to teammates, or offensive line play, or even quarterbacks, whose job is to distribute the ball around while relying on other guys to protect, get open, make the right play, etc? It's not that it can't be done, it is silly to act like you're first, or to but acting like you're the first to have thought about these questions, or to convince journalists to write things like:

Smith says on his website: "Who are the top performers in college football?" is an inherently empirical question. In other words, any attempt to answer this question trespasses overtly on the domain of science.

Science.

There's college football's seven-letter word. It suggests computers, which suggests BCS, which will make some of you stop reading right here.


And Let The Light of Discovery Shine Down Upon Thee. The answer is that it's all a bit silly, and this majestic quest to give awards based on elegant and objective science is a commendable goal, but Mount Everest hasn't been climbed yet, and the way has been paved for some time.

But the other reason why this is so bizarre to me, is why is this so focused on post-season awards? The article linked to implies a suggestion: that Mr. Smith's (perfectly acceptable) goal is to sell his ideas to various decisionmakers who hand out the Doak Walker Award, or the Unitas Quarterback Award, Lou Groza, and the like. That's fine, but for all the arguments about how subjective the post-season awards are, it ignores the question of why they shouldn't be somewhat subjective?

What should be wholly objective is a coaching decision to start one player or another, or to recruit a guy or for an NFL team to hire one as a free agent (marketing aside). That is 100% about getting the best players on the field to perform. (Though that analysis ignores the correlations that might exist among different groups of players, an idea studied much more in depth in basketball than football.)

But with awards, why is it so bad if the Big Schools win? What are these awards? No one has ever sufficiently answered for me whether the Heisman trophy is a "most valuable player" award designed to go to the critical member of a great team without whom the team would fail, or whether it is simply the best individual player in the country, or alternatively (and this is not the same thing), the player who has put in the best performance.

The implicit premise of Smith's site is that it should go to the latter, but I'm not certain that others would agree. Why shouldn't Danny Wuerrfel win the Heisman when the Gators were rolling over people rather than Troy Davis, who was individually quite impressive with over 2,000 yards rushing? Would a supposedly "objective" result be any fairer, one that not only would be subject to the vagaries of the model (which we can't review), but also would discount Wuerrfel's leadership, or ability to get up to throw pass after pass after defender and defender slammed into him head first?

I'm not so convinced that all that is flatly irrelevant in the limited context of postseason awards. Is it a crime that we take all those "subjective" impressions into account? I think not, especially with little to no explanation of the supposedly grand "science" behind the endeavor.

Monday, May 11, 2009

More on Gladwell and underdogs

Again, reiterating my point that likely underdogs benefit from a high variance (i.e. high-risk) strategy, but that it might be inappropriate for heavy favorites. From Dean Oliver, via Basketball Prospectus:

This is very important for a coach like Kentucky’s Rick Pitino. His game plan of three pointers and pressing defense is a high variance strategy, one that an underdog should take, not a favorite. This high variance strategy is how he got his unknown Providence team to the final 4 in 1986. This is how his Kentucky team came back from a record 33 point deficit a year ago. But continuously applying this high variance strategy on a team with great talent like Kentucky is asking for an upset. Kentucky has been among the favorites to win the NCAA title two out of the past three years, only to fall earlier than expected. Again this year, they were favorites, being preseason #1. But their high variance game plan cost them last night against Massachusetts. And it will likely cost them later on this season. Despite Kentucky’s immense talent, coach Rick Pitino’s risky game plan makes the team more susceptible to upsets.

Thursday, April 09, 2009

Median yards per attempt?

Average yards per attempt is the most important stat for measuring efficiency. But what about median numbers?

Pro-Football Reference Blog:

You’ve probably never thought about this before, but how many yards do you think the average QB gets on his median pass attempt? The answer is zero, and for most of NFL history, it was less than that. 2008 was the greatest passing season of all time (by adjusted net yards per attempt), but even this past season, the median pass attempt probably went for only one or two yards.

The average completion percentage was 61% while the sack rate was 5.9%; this means that on every 1,000 dropbacks, 59 times the QB was sacked. On the remaining pass plays, 574 times (61% of 941) of the time the QB completed a pass. So only 57.4% of all pass plays were completed, and surely a bunch of those completions went for negative yards or no gain.

In 1998, the completion percentage was 56.6% and the sack rate was 7.2%; this means only 4.8% of all completions would need to go for no gain (or worse) to make the median pass attempt be zero (or negative). In ‘88, the numbers were 54.3% and 6.8%; only 1.2% of completions would need to go for no gain (or worse) to make the median pass attempt be zero (or negative). In ‘78? A leaguewide completion percentage of 53.1% coupled with a sack rate of 7.9% meant that 51% of all pass plays did not gain yardage even ignoring all completed passes for negative or zero yards.

Passing is high risk, high reward. The large gains offset the risk, which is why teams average more yards per pass than yards per rush. For the passers, frequency of success isn’t nearly as important as quality of the success.

What about rushing? Just the opposite. In modern times, most RBs have a median carry length of three yards. I suspect that’s been the case for the majority of RBs for a long time. LenDale White and his 3.9 YPC last season? Median rush of 3 yards. Adrian Peterson and his 4.8 YPC? Median rush of 3 yards.

Wednesday, April 01, 2009

More thoughts on pro scouts' anger at "system quarterbacks"


Dr Saturday follows up on the weird storyline of trying to get Tim Tebow "NFL Ready" (by doing more under center, etc) even though he is still the quarterback for the defending National Champion Florida Gators who has excelled in a shotgun offense. In other words: what are they doing?

Maybe it is hype, maybe it is real. But at some level it (either the reality or the hype) is driven by the very real fact that NFL scouts now seem to spend the time from the end of bowl season until the draft railing against "spread" and "system" quarterbacks. When pressed to explain this, they proffer ridiculous reasons like the fatal flaw that spread quarterbacks can't take snaps under center and perform traditional drops. (Mike Leach remained unimpressed.) But no matter what the form, the consensus among NFL scouts seems to be the same: "system" quarterbacks (most notably "spread offense" quarterbacks) are bad.

But what are they talking about? Don't they have at least a bit of a point, considering that some college QBs put up huge stats and then are never heard of again? Let's take a step back.

NFL scouting is, of course, very difficult. Scouts must evaluate a player in one environment (college, certain workouts) and extrapolate how that will work in the NFL. In other sports -- most notably baseball -- there's been great strides in taking a player's high school or college numbers (most reliably with college) and getting a decent picture of how good a pro they will be. And this is huge: scouts do not have to solely rely on gestalt impressions like "well, he looks like a ballplayer"; they have at least some degree of certainty.

NFL scouts are not so lucky: many positions -- most notably lineman -- produce very few statistics, and what statistics players produce, whether pancake blocks or touchdown catches, are heavily dependent on the other players on the field. So it's really difficult to turn football data into something meaningful.

Yet, for a time at least, quarterback statistics at least seemed to indicate what talent lay within. A guy couldn't have a great TD-INT ratio or throw for a set number of yards without knowing the game. Or could he? In the late '80s and early '90s some West Coast Offense and Run and Shoot QBs came out of college with huge stats, only to fail miserably in the NFL. They weren't the first QBs to fail, but they had come out with such pedigree -- look at their stats!

So the term "system quarterback" became a slur, roughly translating to: "He who throws for lots of yards and touchdowns in college but will be crap in the NFL."

College coaches -- like Leach -- bristle at the very idea. And it's hard to argue with that: is Leach supposed to apologize for the fact that some guy named BJ Symons threw for nearly 6000 yards and the next year someone else named Sonny Cumbie who threw for 4,700 and then yet another fifth-year senior named Cody Hodges with another 4300? I mean, he throws the ball a lot and would like to win games; it's not to have his guys perform at a level exactly commensurate with their talent to ensure that they don't send any fake signals to NFL scouts.

But, to an extent, I sympathize with NFL scouts. Stats used to at least mean something. But when 45 touchdown passes could equally mean Arena League second-stringer as it could NFL starter, scouts are left again with not a lot more than: "well, he looks like a ballplayer." It's not a very scientific way to pick players, and it's hard.

And in the hyperbolic pre-draft world (Mel Kiper on Percy Harvin: "He’s not that big, and he’s taken a lot of hits. But his explosiveness after the run is explosive.") this confusion injected by good coaches who squeeze talent out of their shotgun operating signal callers arises something like resentment and at minimum a lot of skepticism.

It sounds like I'm giving NFL scouts a break here. And I kind of am: there's not a lot for them to go on. But that doesn't change the fact that they are just guessing and most don't know what they are doing. In Malcolm Gladwell's "quarterback problem" article he sat down with an NFL scout who sat around drooling over Chase Daniel, who might not even get drafted. In baseball, when the Moneyball crowd came in, lots of old school scouts that had dominated for years were swept away like discredited mystics of some defunct religion. If football ever figures it out, the same thing will happen. The guys harping on somebody's "hips" as code or their size of their pinky toe will finally look as foolish as they sound. (Even if there is validity in some of these minor details the question remains what on earth someone could do with all of it to aggregate it into some kind of player ranking.)

So if I have to take sides, put me with the college coaches who aren't afraid to put their QBs in the shotgun and let them run with it and sling it; system moniker be damned. (And I would recommend the same to players considering where to go to school.) And my advice for (most) NFL scouts? Quit, or be fired: NFL drafting would probably be fine without any of this ridiculous minutiae and hyperbole.

Tuesday, March 31, 2009

Speculations on play-calling on first, second, and third and ten

From Advanced NFL Stats:

All the numbers that follow are from all 10-yards-to-go scrimmage plays in the first 3 quarters of regular season games from 2000-2007. The only other limitation was that the game score was within 10 points. I wanted to exclude situations when teams exercised an abundance of either risk or caution.

Note the percentage of play types called on 1st, 2nd, and 3rd downs (with 10 yards to go). There is a fairly even split between run and pass calls on 1st and 2nd downs. On 3rd and 10, the a pass is far more expected.

% of Play Types by Down, 10 Yds To Go

Type - 1st - 2nd - 3rd - Total
Pass - 47.2 - 52.7 - 91.1 - 49.6
Run - 52.8 - 47.3 - 8.9 - 50.4

Although 91.1% isn't 100%, it's close to where the anchor point on the lower right side of the game theory graph--almost the pure pass vs. pass defense strategy combination. Now let's look at the average outcomes for these situations.

Yds Per Attempt by Down, 10 Yds To Go

Type - 1st - 2nd - 3rd - Total
Pass - 7.0 - 6.3 - 6.5 - 6.9
Run - 4.2 - 4.4 - 6.9 - 4.3
Total - 5.5 - 5.4 - 6.5 - 5.6


When passing is most predictable, it yields half a yard less than on first down, when it is less expected. Conversely, running is most successful when it is least expected.

At this point, I should point out that passing on 3rd and 10 yields slightly more yards than on 2nd and 10, which isn't completely what we'd expect. This is almost certainly because defenses will allow short complete passes on 3rd down in exchange for being relatively assured to be able to stop the gain short of 10 yards. This is part of the problem posed by the fact that yards does not equal utility. We'll have to dig a little deeper. The next table lists interception rate by down.

Interception % by Down, 10 Yds To Go

Int Rate
1st - 2nd - 3rd - Total
2.6 - 2.9 - 3.5 - 2.7

Now we see more what we'd expect--a slight increase from 1st to 2nd down, then a large jump on 3rd down, in accordance with the associated increases in passing predictability. The next table lists adjusted yards per attempt, which is YPA with a -45 yd adjustment for every interception thrown. Adj YPA, however, still exhibits the same problem as plain YPA. It underestimates the drop off from 1st to 3rd down in passing effectiveness because defenses will allow gains, as long as they're not more than 9 yards.

Adj Yds Per Attempt by Down, 10 Yds To Go

Type - 1st - 2nd - 3rd - Total
Pass - 5.9 - 5.0 - 4.9 - 5.6
Run - 4.2 - 4.4 - 6.9 - 4.3


So what we can say is, the reduction in passing effectiveness due to predictability is likely at least 1 full adjusted yard per attempt. The drop from 1st down to 2nd was 0.9 yards, so the true reduction in effectiveness from 1st to 3rd down may be far larger.

Except that there's a problem with this analysis. There's a bias in the data. Which teams are more likely to face a lot of 2nd and 10s and 3rd and 10s? The ones that stink at passing. So the 2nd and 3rd down numbers are lower than would be representative of the league as a whole. In other words, poor passing teams 'get more votes' in the analysis.


All this is intended to tee up a game-theory analysis for finding some kind of ballpark run/pass equilibrium. Do read the whole thing.

But a few brief thoughts:

  • The adjusted final numbers intrigue me, particularly second down as compared to first. (As Brian notes, third down is tougher to break down since it's really a binary question of conversion versus failure.) But I'm struck that on second down the yards per pass attempt drops by nearly a full yard while the yards per run goes up only .2: why does the defense get so much better on second down? Is the data skewed to losers? Is play-calling worse on second down?

  • In that vein, I wonder if the old conventional wisdom about "getting back half on second and ten" works against the offense. On first down the passing plays are likely to involve play-action as well as quick or intermediate passes -- coaches can use their full asrsenal; maybe on second coaches are too concerned with screens and quicks -- trying to just get half -- that they give up too much in the way of expected points?

  • But on the other hand, what if they get this 5.0 yards per pass attempt on second and ten with more certainty and less variance than the 5.9 on first down. If so, then possibly the offense is in better position to convert third down than they would be even with a greater expected play value that carried more variance. Could cut either way; football is complicated.

Hopefully Brian can shed some light as his series develops. I look forward to it.

Friday, March 27, 2009

Texas Tech - First-Year QB Comparisons

From Double-T Nation:

For the first time in two seasons, Texas Tech has a brand quarterback and although we're accustomed and grateful for what Graham Harrell did, it's time to look a bit forward and wonder what Taylor Potts might bring to the Red Raiders as a first year starter under Mike Leach's system.

Going into Graham's second year, I asked how much he could improve from one year to the other, but this time I thought that it might be a good idea to take a look at Symons, Cumbie, Hodges and Harrell's first (and sometimes only) year. The nice part about this is that it's a nice mix of players. It's not just one type of quarterback, which means that perhaps there's actually something to gain from looking at what we can expect.

. . .

Playing It Safe

What's the one thing that jumps out at Harrell's 2006 season? For me it's the fact that he had over 50 attempts for every interception. Contrast that with the touchdowns per attempt? Now, contrast that with Symons and what does that tell you? For me, it tells me that Symons was a guy that was going to take chances, while in Harrell's first year, he was dead set on playing it safe, evidenced by the lowest yards per attempt of any of the four, although he only beat out Cumbie in that category by one-one-hundredth of a point. There's got to be some middle ground here, and taking a look at Cumbie's 2004 season, his touchdown to attempt ration is far and away better than his partners in crime. Statistically, he's really not much better than his fellow quarterbacks and lost in all of this, sometimes is that Cumbie was just damned good at putting the ball in the endzone.

My Favorite QB Stat

I've probably beaten everyone over the head about yards per attempt and it's a really bad habit, but if you'll indulge me here, I'll try to make this quick. In the Air Raid offense, there may not be a more telling statistic about the success of a quarterback than yards per attempt. Every offense is better when the team is moving the ball vertically, rather than horizontally. That's probably one of the real misconceptions about Leach's offense, is that the intent may be to make it a dink-and-dump offense, but I think this is more than likely a product of the quarterback rather than the offense itself. Exhibits "A" and "B" are Symons and Hodges. Granted, the Air Raid is not as vertical as many other offenses, but taking last year as an example, Texas Tech ranked 20th in the nation at 8.11 yards per attempt. The offense bogs and becomes not as effective if the pass is going sideline to sideline.


While I completely agree that yards per pass attempt is the most valuable passing statistic, I also think it can be adjusted slightly to better capture the issue Seth is looking at here. Specifically, you can factor in interceptions using a simple rule of thumb. This is relevant here particularly for the raw numbers between Graham Harrell's first season, in 2006, and B.J. Symons's first and only season, in 2003.

- With raw numbers, Symons threw for 5336 yards on 666 attempts, for a yards per attempt of 8.01. He also threw 21 interceptions.

- For Harrell in 2006, he threw for 4555 yards on 617 attempts, along with only 11 interceptions.

What the stat guys are doing now is subtracting 45 yards for every INT thrown: they've crunched the numbers, and this is about what it takes away from you in terms of field position, scoring probability, etc.

If you did that for Harrell in 2006 (multiplying 11 times 45 yards and subtracting that from his raw passing yards) you get him 4060 adjusted total yards. Compare that with Symons' 21 INTs, which brings his total down to 4391. This makes their adjusted yards per attempt stats now 6.58 (Harrell) and 6.59 (Symons) -- nearly the same, though by different roads. Interesting, no?

The other X factor is QB sacks/runs. College stats make this hard of course: in the NFL, sacks are counted against passing yards and thus factored into yards per attempt. For Texas Tech QBs I think the safest thing is to just count the rushing attempts and yards all as part of the adjusted yards per attempt. (If this was Oregon or Tebow at Florida it'd be very difficult to do this without completely going back to the raw data and recreating the "sacks" and "yards lost by sack" statistics.)

Harrell's rushing stats in 2006 were 32 rushing attempts for -66 yards. Throwing that with the above adjusted numbers makes his new adjusted-adjusted total yards 3994, his total adjusted-adjusted attempts 649, and his adjusted-adjusted yards per pass attempt 6.15.

For Symons, in 2003 he rushed 74 times for 140 yards. Adding this to his passing attempts/yards we get 740 attempts and 4531 adjusted-adjusted yards. (I know that this number, unlike Harrell's, is actually positive, but I think it defensible to add it all back in because few Tech QB runs -- other than sneaks -- are called run plays.) So the adjusted yards per attempt is 6.12.

So Harrell actually beats out Symons in adjusted-adjusted yards per attempt, 6.15 to 6.12, though that's basically too close to make a call. I think it reinforces Seth's point that Leach has gotten it done with QBs of vastly different styles, especially considering these two guys were (probably) the best of that run by Leach where each first-year QB excelled that Harrell broke by starting more than one season.

In any event, the real point of this is to show how you might compare apples to oranges for any system or QB, with a guy like Symons who was acting as more of a gunslinger and Harrell who -- within the confines of Leach's wide-open offense -- was operating slightly more conservatively.

(I don't have exact cites but credit must be due to Advanced NFL Stats and the Pro Football Reference Blog, both of whom have undertaken similar analyses.)

Wednesday, February 18, 2009

Conservative and risky football strategies (and kurtosis)

Brian from Advanced NFL stats recently posited that some NFL teams (namely, the Washington Redskins under Jim Zorn) might have been throwing too few interceptions. This was because the lack of interceptions was a symptom of playing too conservatively, and therefore costing the Redskins games.

Implicit in Brian's thoughtful article are a couple of assumptions that I want to unpack, because radically different strategies might be appropriate depending on the level of football.

  • The first assumption is that a lack of passing (or passing aggressively) costs the offense points. This is undoubtedly correct: on average, passes garner more yards per play than runs, and an equilibrium playcalling strategy will seek to maximize the returns for each play (whether in terms of yards, first downs, or points).
  • The second assumption appears to be that maximizing yards and points is the optimal strategy for an offense. Hence, the lack of interceptions means that the team is leaving points on the board, thus costing it games. This is the assumption I want to address in slightly more detail.

Is it always "optimal" to set your strategy to maximize points scored?

In the NFL -- which is what Brian focuses on -- this is likely true and the assumption holds. NFL teams are almost all competitive with each other, and even the worst teams can beat the best in a given game. So any reduction in expected points is likely to hurt a team's chances of winning because they need to maximize that out to get wins.

But is that true in college? Or in high school? Think about when Florida plays the Citadel. The Gators have a massive talent advantage compared with the Bulldogs. As a result, what is the only way they can lose? You guessed it: by blowing it. They can really only lose if they go out and throw lots of interceptions, gamble on defense and give up unnecessary big plays, or just stink it up.

A fan or some uninitiated coach might see this as a lack of effort, but another view might be that Florida used an unnecessarily risky gameplan that cost them a victory. And since we know that they would win almost every time, what did they gain by being more aggressive? Even if they gained in expected points, this is something like the difference between a forty-point and sixty-point victory, which ought to be irrelevant. (I leave aside BCS calculation questions, which very well might make it worth it to increase the risk of loss to get a bigger chance of a blowout victory.)

The upshot then is that, for the storied programs with large talent advantages, there is seemingly more downside than upside to being very aggressive, either on offense or defense. While it might increase the risk of blowing the opponent out, it also increases the risk of stumbling.

The flipside: the underdog

It's a well-worn belief that underdogs -- i.e. the kind of severely outmatched opponent that cannot win without some good luck -- must employ some risky strategies to succeed. This has long been believed but now we have a reason, though it also teaches us that there is a price to this bargain. The underdog absolutely must take the riskier strategy, whether by throwing more and more aggressively, by onside kicking, or doing flea-flickers and trick plays. They have to get lucky. In the process, however, they also increase the chance that they will get blown out, possibly quite badly. But isn't that worth the price of a shot at winning? Florida might pick off the pass and run it back for a touchdown; they might sack the quarterback and make him fumble; they might blow up the double-reverse pass. If so, then things look grim. But what if they didn't? And if the team didn't do those things, how can it beat them by being conservative? By waiting for Florida to make mistakes?

Get technical

Let's take a quick step back and talk about what is happening from a probability standpoint. What does a more aggressive (and thus more risky) strategy do to our expected outcomes? Hopefully everyone is familiar with the bell-curve, which is a graphic way of depicting the range of possible outcomes based on the probability of their occurrence. The normal distribution is the most common, and it assumes that outcomes on the left and right are as likely as the average outcome. Here, let's assume this is the curve for an offense that can be expected to score around 28 points a game.


Now, let's say they decide to ramp it up. They want to score more points, but this is a riskier strategy, and therefore the range of outcomes will vary more wildly. Below is the new curve, which has moved to the right (to reflect the greater expected points) but is also flatter -- a measure of kurtosis -- which makes the "tails," or ends of the curve "fatter."

(Remember, the height of the curve is the probability of the event happening. Although with the moved curve the whole offense now is expected to score more points, it is now less bunched around the middle because the strategy employed is riskier and hence has more variance or variety.)


What does this tell us? It really just reaffirms what we'd already guess (and assumes that we know what strategies are both riskier and more rewarding, which is an assumption but generally involves passing more). Our offense now: (a) averages more points, (b) has an increased chance of scoring in the forties and blowing out the opponent than before (represented by the shaded green area), but (c) has an increased chance of blowing it and scoring fewer points than our more conservative -- and less variant -- strategy from before. Hence, you might maximize your points but you might actually increase your chance of losing in the process.

Now, remember I'm making assumptions about the nature of the curve. There's also a probability phenomenon known as skewness, which might mean that the improved strategy actually will rarely ever incur a bad game and all the variance will be good.

But the reason I took this mathematical approach to this is that this is really the lesson of the financial crisis as applied to these Wall Street gurus, imported to football: you can "improve" your strategy, you can increase your expected gain, you can increase your chance of blowout wins, but in the process you might be sowing the seeds of your own unlikely, but catastrophic demise. Sort of Black Swans for football.

Spurrier and keeping it close

So in the NFL, where teams are almost all competitive (save, maybe the Detroit Lions), it's likely the best strategy to simply maximize expected points and to go from there. But in other levels, with talent disparities of all sorts, it is trickier, as we have seen.

In the 1990s, Steve Spurrier's Florida Gators were undoubtedly some of the most talented teams of the decade. They were also some of the most aggressive. As a result, they absolutely destroyed some teams. Of course there were the seventy-point blowouts of Kentucky, but what about when they scored more than sixty against Phil Fulmer's Tennessee Volunteers? Yet, Spurrier never once went undefeated with the Gators: his teams always seemed to drop a game or two that maybe they shouldn't have. And those losses almost always had the same profile -- too many interceptions, couldn't run the ball at all, and too many big plays given up on defense. I can't believe I'm inclined to say this, but maybe Spurrier should have been more conservative? He might not have won as many games by sixty or seventy, but maybe they would have gone undefeated and won more than one title?

On the flipside, almost every week of the season I see teams go to Southern Cal, LSU, or Ohio State, and pretty much give up all hope of winning in the name of "keeping it close and winning it in the fourth quarter." As outlined above, this might be the worst strategy against such teams. They have little chance of winning on the merits, so what they need to do is flatten the tails and increase the chance for a shocker: take risks, and hope their coin flips go in their favor. Maybe they won't. Maybe they get blown out. But not taking those chances is a surefire way to set their low chance of winning in stone.

Yet, much like with David Romer's paper where he observed that NFL coaches probably don't go for it on fourth down enough, there are external and likely irrelevant reasons that deter coaches from employing a true "risky-underdog" strategy: the risk that the coach will get fired. I am advocating here that underdogs go for it and increase the calculated risk they take on. (Keep in mind that you can go overboard on this. Chucking the ball forty yards downfield every play, while risky, would not increase your scoring or even chance of winning because you'd become predictible and downright silly. It's about calculated risk.)

But there are real costs -- at least for the coach -- of getting blown out. And make no mistake, the bargain for a greater chance of winning includes the greater chance of getting thrashed. Maybe this should be irrelevant -- a win is a win and a loss is a loss. But a blowout loss has collateral effects, even if they are purely psychological and emotional. You can lose recruits, you can lose donations, and you can lose your job. Look at Mike Shanahan with the Broncos. He was on the hotseat, but he lost his job primarily because Denver got blown out in their final game. I don't necessarily think that was because his team took on increased risk, but people do not tolerate ugly defeats, rational or not.

Similarly, there might be real gains for an underdog to just "keep it close" with a big boy without ever having a real chance of winning. People discount moral victories, but if such and such team can "keep it close" with USC, then they get all kinds of accolades and possibly even confidence going into the following weeks. But if they employed the risky-underdog strategy, then they might gain a slight marginal increase for a victory, with a steeper increase in the chance of getting buzzsawed right off the field (remember skewness).

So, from the perspective of being purely focused on winning football games, I think the implications of the risky/conservative strategy dynamic in the context of teams with wide talent disparities has some pretty dramatic implications. But in the real world, there's lots of other factors, including the felt need by the coach to protect his own skin. Yet, he might be costing his team a chance at victory.

Michael Lewis on basketball statistics

Not directly on topic for this site but it's hard to pass up an opportunity to mention a new Michael Lewis piece. This one is very Moneyball. It's about the Houston Rockets' forward Shane Battier, and the thesis is that, despite his low-scoring output he is one of the best "value" players in the NBA because of the little things he does and defensive prowess, and all that is quantifiable these days. The article is extraordinarily well-written (as always), and contains great summations of an analytical approach to sports, as is usual for a Lewis piece:

Here we have a basketball mystery: a player is widely regarded inside the N.B.A. as, at best, a replaceable cog in a machine driven by superstars. And yet every team he has ever played on has acquired some magical ability to win.

Solving the mystery is somewhere near the heart of Daryl Morey’s job. In 2005, the Houston Rockets’ owner, Leslie Alexander, decided to hire new management for his losing team and went looking specifically for someone willing to rethink the game. “We now have all this data,” Alexander told me. “And we have computers that can analyze that data. And I wanted to use that data in a progressive way. When I hired Daryl, it was because I wanted somebody that was doing more than just looking at players in the normal way. I mean, I’m not even sure we’re playing the game the right way.”

The virus that infected professional baseball in the 1990s, the use of statistics to find new and better ways to value players and strategies, has found its way into every major sport. Not just basketball and football, but also soccer and cricket and rugby and, for all I know, snooker and darts — each one now supports a subculture of smart people who view it not just as a game to be played but as a problem to be solved. Outcomes that seem, after the fact, all but inevitable — of course LeBron James hit that buzzer beater, of course the Pittsburgh Steelers won the Super Bowl — are instead treated as a set of probabilities, even after the fact. The games are games of odds. Like professional card counters, the modern thinkers want to play the odds as efficiently as they can; but of course to play the odds efficiently they must first know the odds. Hence the new statistics, and the quest to acquire new data, and the intense interest in measuring the impact of every little thing a player does on his team’s chances of winning. In its spirit of inquiry, this subculture inside professional basketball is no different from the subculture inside baseball or football or darts.


The key-stat that is used to evaluate Battier's importance is a modified version of the "plus/minus" stat first used in Hockey. The basic gist is one just looks at how good the team does with a player in the game versus out of the game -- i.e. how much do they outscore or get outscored by their opponents. Of course, the raw version of this stat is misleading, because all players from good teams would shoot up the rankings while those on bad teams, even excellent players, would fall far.

Supposedly, the Rockets' manager Daryl Morey has developed this stat further, though is cagey about how. But he is quite confident that Battier has one of the best "plus/minus" values in the league.

Phil Birnbaum of the Sabemetrics Research site is not entirely convinced:

[A]s I said, I'm a bit skeptical, still. I accept that Battier must be exceptionally good at defense, since (a) he plays 33 minutes a game and doesn't have very much in the way of traditional offensive statistics; (b) the Rockets have watched him and studied him and think he's great; and (c) his teams have done well. Still, from a scientific standpoint, the article is mostly anecdote and hearsay.

It shouldn't be all that hard to confirm the article's thesis and measure the size of the effect. If Kobe [Bryant] is good from one place but worse from another, that can be figured out by watching games and counting. If Battier holds him to those low-percentage shots when covering him, that can be counted too. And at the most fundamental level, can't you see what Kobe (and the other players) do when covered by Battier, and compare to what they do against the Rockets when Battier's on the bench? Something is better than nothing.

It's not really that I don't believe the Rockets. It's just that +6 points a game -- when it's acknowledged that Battier isn't all that great on offense – seems pretty high to me, and my instinct is to ask for more evidence.


One answer might be that the evidence is there, but that it is still proprietary. That was Morey's answer in the Lewis piece. Nevertheless, this does indicate to me that people are on the right track in at least trying to really analyze sports, and not get bogged down in trivia.

As a final note, the WSJ Numbers Guy, with a great sense of timing, offers up a post about the plus/minus stat featured in the Lewis article:

Earlier this week, [Mark] Cuban posted to his blog a list of the 30 NBA players who have the biggest positive impact on their teams when they’re in the game. They were ranked by a measure inspired by hockey’s plus/minus statistic, reflecting how well a team does with a player on the court, after accounting for the other players on the court with him. Cuban’s plus/minus adjusts for how good the team is without the player on the court as well as for the opponent and for game situations. (Without such adjustments, players on a top team like the Los Angeles Lakers would all look good, because the Lakers so often dominate.) . . . .

I sent Cuban’s surprising ratings to Roland Beech, proprietor of the NBA stats site 82games.com, for comment. Beech works on player analysis for the Mavericks and incorporates a version of plus/minus into his own player ratings. But that didn’t keep him from criticizing the numbers Cuban posted. Cuban and Wayne Winston, who developed the system for him, responded. What resulted was a polite yet spirited debate among Cuban and his advisors about how to best analyze players.

Beech told me he considered plus/minus ratings, as adjusted by regression analysis, “one of the most over-hyped player rating systems.” He pointed to the incongruous finding that [Sebastian] Telfair is more valuable than [Dirk] Nowitzki, and blamed other questionable results — San Antonio Spurs point guard Tony Parker as a below-average player — on a paucity of data on top players’ performance without their star teammates. Beech also argued that there is too much noise in the system, because a player’s value is determined by coaching schemes, injuries and their assigned roles. . . .

Winston, the professor of operations and decision technologies at Indiana University who developed the system for Cuban, said that no system is perfect, but that plus/minus beats other player analyses because it can reflect defensive prowess — and Nowitzki’s defense was subpar at the beginning of the season. It’s with defense, Winston said, that plus/minus “really shines,” because defensive stats such as blocked shots, rebounds and steals can’t encapsulate a player’s worth.


We still need more and more of this kind of development with football. At least they're trying.